User Engagement: Definition, Tracking And Improvement
Zunnun · · 11 min read
User engagement metrics connect behavioral signals, metric selection, engagement tracking and benchmark interpretation into one measurement system for product, website, app and content performance. This guide defines the metric family, separates useful signals from noise, maps metrics to business models and shows how reporting connects engagement data to retention, conversion and improvement decisions.
What Are User Engagement Metrics?
User engagement metrics are quantitative and qualitative signals that show how people interact with a product, website, app, content asset, campaign or brand experience. They include active users, session behavior, feature usage, clicks, scroll depth, comments, shares, saves and return visits.
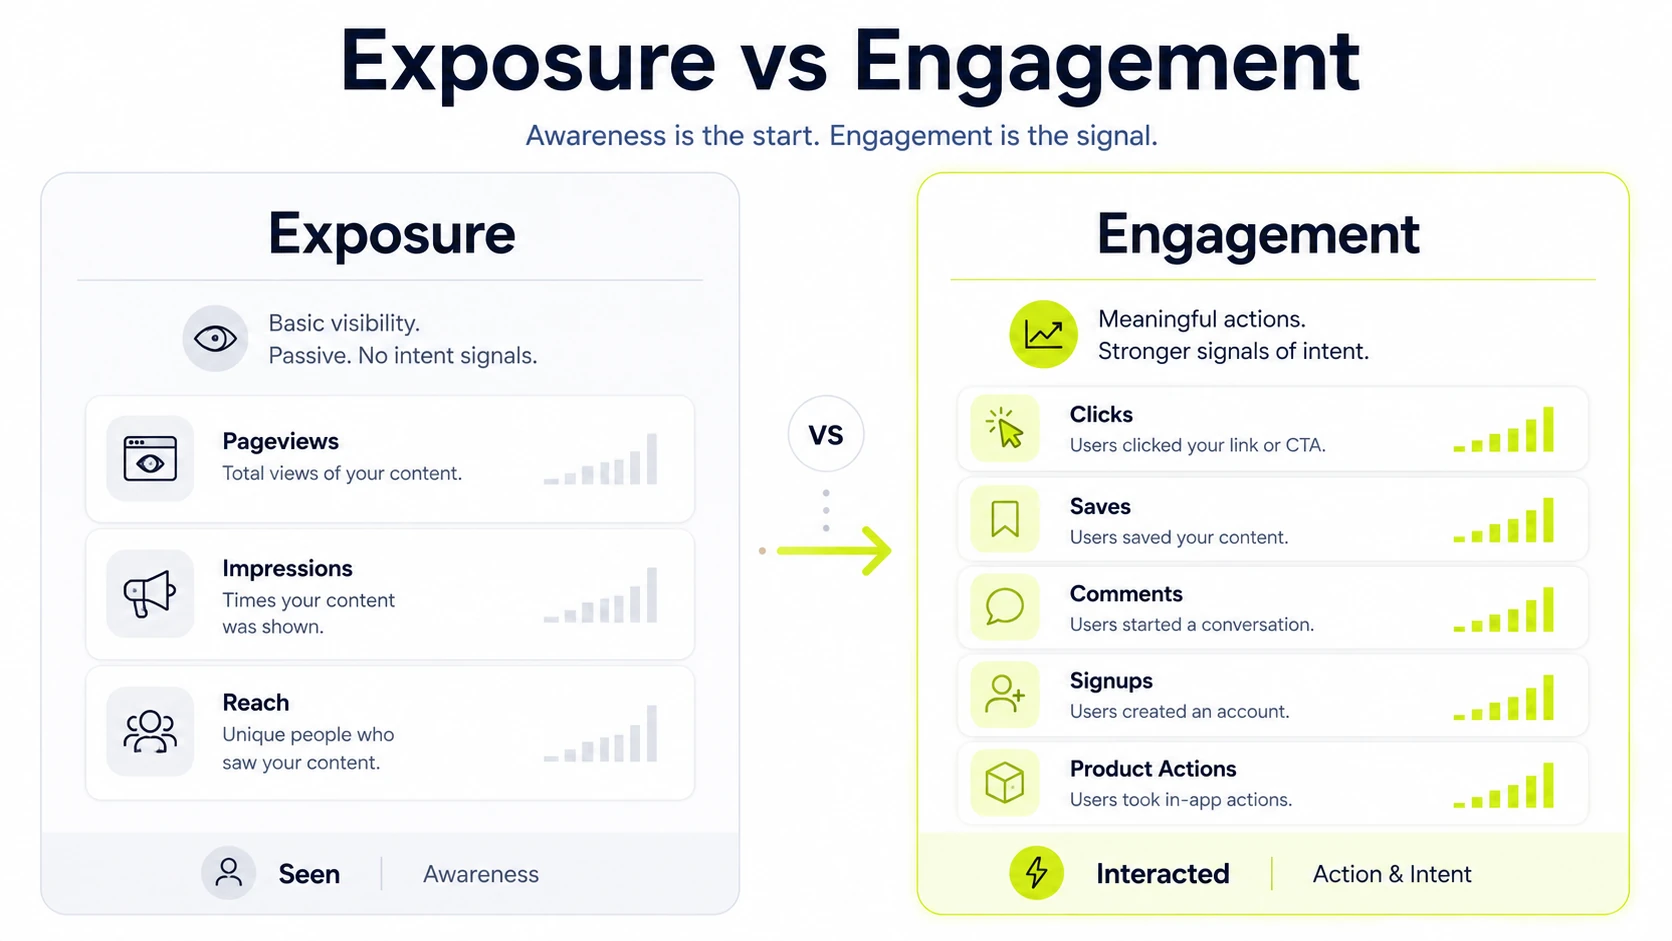
These measures describe interaction patterns rather than simple exposure. A pageview, login, feature click, account action or support conversation becomes useful when it connects to a value action, user journey stage or decision that the team controls.
Why Do User Engagement Metrics Matter?
User engagement metrics matter because they show whether users reach value, return with intent and interact with the parts of the experience that affect retention, customer health and revenue quality. A high count alone means little unless the behavior supports a business decision.
- Retention: repeated usage and return visits show whether users keep finding value.
- Churn risk: declining product activity, fewer sessions or lower account engagement signal intervention timing.
- Product decisions: feature adoption and completion data show where onboarding, UX and discovery require changes.
- Revenue quality: engaged accounts create stronger renewal, expansion and conversion signals than passive users.
How Do You Choose The Right User Engagement Metrics?
Choose user engagement metrics by matching the business model, user journey, platform and value action before selecting KPIs. The right metric answers a decision question: what behavior changed, which segment changed and what action follows from the change?
The centrepiece decision is metric selection. A SaaS product, media site, marketplace, ecommerce store and B2B account dashboard treat engagement differently because each one defines value through a different repeat behavior.
|
Context |
Primary signal |
Decision it supports |
|---|---|---|
|
SaaS product |
Feature usage, DAU/MAU and activation milestones |
Improve onboarding, adoption and customer health |
|
Website |
Engagement time, return visits and scroll depth |
Improve page structure, intent match and conversion paths |
|
Content or social |
CTR, comments, shares, saves and watch time |
Improve topic selection, format and distribution |
|
Customer success |
Account activity, support signals and usage depth |
Prioritize outreach, renewal risk and expansion timing |
Which Product And SaaS Engagement Metrics Matter?
Product and SaaS engagement metrics matter when they measure repeat product use, feature adoption, activation progress and habit formation. DAU, WAU, MAU and DAU/MAU ratio show activity frequency, while feature adoption and time to value show whether users reach the product outcome.
|
Metric |
What it shows |
Decision it supports |
|---|---|---|
|
DAU, WAU and MAU |
Active user volume by time window |
Capacity planning and engagement trend checks |
|
DAU/MAU ratio |
Product stickiness and usage frequency |
Habit strength by product type |
|
Feature adoption rate |
Share of users using a key feature |
Feature discovery and onboarding changes |
|
Activation completion |
Share of users reaching a value milestone |
Onboarding and time-to-value improvements |
Which Website Engagement Metrics Matter?
Website engagement metrics matter when they show how visitors interact with page content, navigation and conversion paths. Average engagement time, pages per session, scroll depth, click events, bounce rate and return visits reveal whether the page satisfies search intent and supports the next action.
|
Metric |
What it shows |
Decision it supports |
|---|---|---|
|
Average engagement time |
Time with the page in focus |
Content depth and relevance checks |
|
Pages per session |
Navigation depth across the site |
Internal linking and journey design |
|
Scroll depth |
How far users reach on a page |
Layout, copy order and CTA placement |
|
Return visit rate |
Repeat interest from the same audience |
Remarketing, content quality and audience fit |
Which Content, Social And Campaign Engagement Metrics Matter?
Content, social and campaign engagement metrics matter when they measure intentional audience interaction with a post, asset, ad or message. Engagement rate, CTR, comments, shares, saves and watch time show whether the format, topic and channel match audience intent.
- CTR shows whether a headline, creative or CTA earns the next click.
- Comments and replies show response depth, objections and topic relevance.
- Shares and saves show future-use intent or public endorsement.
- Watch time shows content retention for video and long-form media.
How Do You Calculate User Engagement Metrics?
Calculate user engagement metrics by defining the event, population, time window and denominator before applying a formula. A calculation without those four inputs mixes users, sessions, accounts and events into one unreliable number.
- Select the value action, such as login, feature use, scroll depth, video completion or form submission.
- Define the counted population: users, sessions, accounts, visitors or content viewers.
- Set the time window: daily, weekly, monthly, campaign period or cohort age.
- Apply the formula with a consistent denominator.
- Segment the result by cohort, source, plan, device or lifecycle stage before making decisions.
|
Metric |
Formula pattern |
Use case |
|---|---|---|
|
Engagement rate |
Engaged sessions or interactions divided by total sessions or reach |
Website, content and campaign quality |
|
DAU/MAU ratio |
Daily active users divided by monthly active users |
Product stickiness and usage frequency |
|
Feature adoption rate |
Users using a feature divided by eligible users |
Feature discovery and activation |
|
Completion rate |
Completed target actions divided by started actions |
Onboarding, funnel and task success |
How Do You Track User Engagement Metrics?
Track user engagement metrics by connecting event definitions, analytics tools, CRM data and dashboard views to the same measurement plan. Product analytics, GA4, event tracking, heatmaps, session replay and data warehouse tables record different parts of the same behavior.
- Create a tracking plan with event names, parameters, owners and definitions.
- Configure web and product events in GA4, a product analytics platform, GTM, SDKs, or server-side tracking where applicable.
- Validate events with DebugView, realtime reports, tag previews, warehouse checks and sample user journeys.
- Connect engagement events to CRM or customer success records when account-level decisions use the metric.
- Build dashboard views for trend, cohort, segment and alert monitoring.
How Do You Define Events Before Tracking?
Define events before tracking by documenting the action name, trigger rule, user context, parameters and business meaning. Event taxonomy prevents noise from duplicate names, vague clicks and low-value interactions that look active but do not show value.
- Name the event with a stable verb-noun pattern.
- Record the trigger rule and eligible user state.
- Attach parameters such as plan, feature, page type, source and account ID.
- Mark whether the event is a value action, diagnostic signal, or support event.
How Do You Segment Engagement By Cohort, Channel And User Type?
Segment engagement by cohort, channel and user type by splitting the same metric across lifecycle stage, traffic source, plan, persona, account type, device and geography. A blended average hides whether new users, returning accounts, paid traffic, organic traffic or mobile users changed behavior.
- Cohort segmentation separates new, retained, reactivated and churn-risk users.
- Channel segmentation separates organic, paid, referral, direct, email and social traffic.
- User-type segmentation separates role, persona, plan, device, account size and region.
What Benchmark And Baseline Rules Make User Engagement Metrics Useful?
A user engagement benchmark is useful when it compares the same metric definition, platform type, audience segment and time window. External averages create direction only; internal baselines, cohort movement and channel-specific trends create decision context.
|
Benchmark context |
Baseline method |
Comparison risk |
Action trigger |
|---|---|---|---|
|
SaaS usage |
Compare DAU/MAU and activation by cohort |
Products vary by natural usage frequency |
Cohort drop after onboarding or release |
|
Website content |
Compare engagement time and scroll depth by page type |
Search intent changes page behavior |
Large page-type decline or ranking-page mismatch |
|
Campaign engagement |
Compare CTR and interaction rate by channel |
Channel formats define different actions |
Creative fatigue or low-intent traffic |
|
Customer success |
Compare account activity by plan and lifecycle |
Account size changes usage depth |
Renewal-risk accounts lose key activity |
When Do User Engagement Metrics Become Misleading?
User engagement metrics become misleading when activity volume looks strong but the behavior reflects friction, invalid traffic, tracking artifacts, vague definitions, or vanity activity. High clicks, long sessions and repeated visits require context before they become a positive signal.
- Vanity activity: impressions, reach, or pageviews without a value action inflate reporting.
- Friction-driven behavior: repeated clicks, long task time, or retries show confusion instead of progress.
- Tracking artifacts: duplicate events, broken triggers and inconsistent parameters create false trends.
- Bot or invalid traffic: automated visits and fraudulent clicks distort session, click and rate metrics.
- Segment mixing: combining new users, retained users and internal users hides the real behavior change
How Does Bot Or Invalid Activity Distort User Engagement Metrics?
Bot or invalid activity distorts user engagement metrics by adding automated sessions, fraudulent clicks, internal users and non-human events to human behavior reports. The result changes engagement rate, page activity, campaign CTR, scroll depth and conversion-assisted signals.
- Filter known bots, internal IP ranges, QA users and monitoring tools.
- Review abnormal spikes by source, geography, device, event frequency and session duration.
- Separate ad-fraud or click-farm signals from real audience interaction.
- Keep raw and filtered views when audit trails matter.
How Do User Engagement Metrics Differ From Retention And Conversion Metrics?
User engagement metrics differ from retention and conversion metrics because they measure interaction depth before, between, or around outcome events. Retention measures return behavior across time. Conversion measures completion of a target action. Engagement explains the behavior that contributes to both.
|
KPI family |
Definition |
Signal |
Funnel role |
Decision use |
|---|---|---|---|---|
|
Engagement |
Depth and frequency of interaction |
Clicks, sessions, feature use and content actions |
Middle behavior |
Improve experience and value delivery |
|
Retention |
Return or continued use over time |
Repeat visits, active accounts and renewal behavior |
Lifecycle continuity |
Reduce churn and increase habit formation |
|
Conversion |
Completion of a target action |
Signup, purchase, demo, form submit, or key event |
Outcome point |
Improve funnel and revenue actions |
Which Mistakes Break User Engagement Reporting?
User engagement reporting breaks when metric definitions, segments, owners and action thresholds are missing. A dashboard with many numbers but no decision rule creates reporting noise instead of measurement clarity.
- Tracking too many metrics: select a smaller set tied to value actions and business decisions.
- Using unclear definitions: document every formula, event name, denominator and time window.
- Ignoring segments: separate user cohorts, traffic sources, devices, plans and account types.
- Treating vanity metrics as outcomes: connect activity to activation, retention, conversion, or customer health.
- Missing ownership: assign a metric owner, review cadence and action threshold for each dashboard item.
How Do You Improve User Engagement Metrics?
Improve user engagement metrics by tying each metric change to a specific product, content, lifecycle, UX, or support action. The fix depends on whether the problem is onboarding, feature discovery, content quality, campaign fit, technical friction, or customer health.
- Find the segment where the decline or opportunity appears.
- Identify the value action connected to that segment.
- Check whether tracking noise, bots, internal users, or broken events changed the metric.
- Improve the nearest controllable experience: onboarding step, feature prompt, page layout, content format, lifecycle message, or support follow-up.
- Measure the same segment after the change with the same formula and time window.
Does High User Engagement Signal User Friction?
Yes. High user engagement signals user friction when repeated clicks, long sessions, frequent retries, or repeated support visits happen without task completion. The deciding test is outcome quality: productive activity reaches a value moment, while friction-driven activity repeats effort without progress.
Do User Engagement Metrics Require Cohort Segmentation?
Yes. User Behavior tracking metrics require cohort segmentation when teams use them for product, retention, customer success, or campaign decisions. Cohorts separate new users, returning users, plan types, traffic sources and lifecycle stages so one blended average does not hide different behavior patterns.
Does Bot Activity Inflate User Engagement Metrics?
Yes. Bot activity inflates user engagement metrics by adding automated sessions, clicks, pageviews and events to digital analytics reports. Filtering rules, internal-user exclusions, traffic-source review and abnormal-pattern checks protect engagement rate, scroll depth, CTR and conversion-assisted signals.
Is DAU/MAU Always A Reliable User Engagement Metric?
No. DAU/MAU is reliable only when the product has a natural daily or frequent-use pattern. A weekly reporting tool, seasonal app, or occasional workflow produces lower stickiness without weak engagement, so usage frequency and value moments define the interpretation.
Does Engagement Rate Transfer Across Channels?
Yes, with limits. Engagement rate transfers across channels only when definitions, audience intent, format and measurement rules match. A social save, email click, video completion and website engaged session describe different behaviors, so benchmark comparisons require channel context.
Does Qualitative Feedback Explain User Engagement Metric Changes?
Yes. Qualitative feedback explains metric changes by showing the reason behind a behavioral signal. Survey responses, support tickets, session observations and usability notes connect engagement tracking back to metric selection, benchmark interpretation and the decision context behind improvement work.

Written by
Zunnun
Digital analytics consultant helping businesses make data-driven decisions. Specializing in GA4, GTM, conversion tracking, and marketing attribution to turn messy data into profitable growth strategies. Semantic SEO expert in the Koray Tuğberk Gübür methodology.