SaaS Website Metrics: Traffic Quality, Conversions, Revenue and Mistakes
Track SaaS website metrics across traffic quality, conversions, revenue, retention, CAC, dashboards, benchmarks and mistakes.
Zunnun · · 14 min read
SaaS website metrics connect traffic quality, website conversion, revenue influence, retention and CAC payback across the acquisition funnel. A useful measurement plan separates website analytics from broad company KPIs, maps each metric to a decision and keeps dashboard reporting focused on the actions that improve qualified pipeline, activation and retained recurring revenue.
What Are SaaS Website Metrics?
SaaS website metrics are website performance indicators that show how effectively a SaaS site attracts qualified visitors, converts them into leads or users and connects those actions to recurring revenue outcomes. The metrics combine web analytics, conversion tracking, product activation data and customer retention signals.
- Traffic metrics show qualified sessions, source quality and landing page engagement.
- Conversion metrics show demo requests, trial signups, form submissions and pricing-page actions.
- Revenue metrics connect website actions to pipeline, new MRR, ARR and expansion MRR.
- Retention metrics show whether converted users become retained customers or churned accounts.
These metrics turn website measurement into a decision system for acquisition, activation, revenue and retention.
How Do Website Metrics Differ From Broader SaaS Business Metrics?
Website metrics measure visitor behavior, channel quality and conversion actions before or during acquisition, while broader SaaS business metrics measure recurring revenue, retention, customer economics and company performance after acquisition. Website analytics are leading indicators. SaaS business metrics are outcome indicators.
|
Metric type |
What it measures |
Primary owner |
Example metrics |
|---|---|---|---|
|
Website metrics |
Visitor behavior and conversion paths |
Marketing and growth |
Sessions, demo requests, trial signups, pricing-page conversion |
|
Product metrics |
In-product adoption and activation |
Product and growth |
Activation rate, PQLs, feature adoption, time to first value |
|
Revenue metrics |
Subscription income and account value |
Finance and revenue operations |
MRR, ARR, ARPU, expansion MRR |
|
Retention metrics |
Customer continuation and account health |
Customer success and finance |
Churn rate, NRR, GRR, renewal rate |
|
Efficiency metrics |
Acquisition cost and payback |
Marketing, sales and finance |
CAC, CAC payback, LTV:CAC |
A SaaS website dashboard has stronger decision value when it connects website metrics to these downstream SaaS outcomes.
Which Metrics Should A SaaS Website Track?
A SaaS website tracks metrics across acquisition, engagement, conversion, activation, revenue influence and retention so each funnel stage has a clear performance signal. A flat KPI list hides the reason performance changes. A grouped framework shows which team owns each decision.
The core SaaS website metrics to track are grouped below by funnel stage.
|
Funnel stage |
Metric |
Why it matters |
Decision it supports |
|---|---|---|---|
|
Acquisition |
Qualified sessions by source |
Separates useful traffic from empty volume |
Budget allocation by channel |
|
Engagement |
Engaged sessions and key page depth |
Shows whether visitors inspect product, pricing or proof pages |
Landing page and content updates |
|
Conversion |
Demo requests, trial signups and visitor-to-lead rate |
Measures website demand capture |
CTA, form and offer testing |
|
Activation |
Trial activation rate and first value completion |
Connects signup quality to product adoption |
Onboarding and product-led growth changes |
|
Revenue influence |
Pipeline value, closed-won revenue and new MRR |
Connects website journeys to sales outcomes |
Campaign, content and sales follow-up decisions |
|
Retention |
Churn rate and NRR by acquisition source |
Shows whether converted accounts stay |
Channel quality and ICP targeting |
How Should SaaS Websites Measure Traffic Quality?
SaaS websites measure traffic quality by comparing visitor source, search intent, ICP fit, landing page engagement and conversion contribution. Raw sessions only show volume. Qualified traffic shows whether visitors match the audience, inspect buying pages and create demos, trials, pipeline or retained customers.
Use this checklist for traffic quality:
- Source intent: organic, paid, referral, partner and direct channels mapped by buyer stage.
- Landing page relevance: page topic, CTA and search intent match.
- Engagement signal: engaged sessions, scroll depth, product page visits and pricing-page visits.
- ICP fit: company size, industry, geography, persona and account quality.
- Conversion contribution: assisted demo requests, trial starts, pipeline and new MRR.
Which Website Conversion Metrics Matter For SaaS?
The SaaS website conversion metrics that matter most are the actions that show buyer intent and connect to pipeline, activation or revenue. Demo requests, trial signups, contact submissions, pricing-page conversion and qualified conversion rate reveal more than a single sitewide conversion rate.
|
Conversion metric |
Definition |
Best fit |
Decision it supports |
|---|---|---|---|
|
Visitor-to-lead rate |
Percentage of visitors that submit a lead action |
Sales-led and hybrid SaaS |
Page offer and CTA testing |
|
Demo request rate |
Percentage of visitors requesting a product demo |
Sales-led SaaS |
Sales capacity and qualification rules |
|
Trial signup rate |
Percentage of visitors starting a free trial |
PLG and self-serve SaaS |
Product onboarding and signup flow changes |
|
Pricing-page conversion |
Percentage of pricing-page visitors that convert |
All SaaS motions |
Packaging, pricing clarity and CTA placement |
|
Qualified conversion rate |
Percentage of conversions matching ICP or qualification rules |
B2B SaaS |
Channel quality and lead routing |
|
Contact form completion |
Percentage of form starts that submit successfully |
Lead generation pages |
Form length and validation fixes |
Which Revenue Metrics Should Connect To SaaS Website Performance?
Revenue metrics connected to SaaS website performance show how traffic, landing pages and conversion paths influence pipeline, MRR, ARR and expansion. The website does not own every revenue outcome, but it supplies measurable acquisition and intent signals that revenue teams use for growth decisions.
|
Revenue metric |
Website connection |
Use case |
|---|---|---|
|
Pipeline value |
Demo forms and qualified conversions create opportunities |
Compare landing pages by sales value |
|
Closed-won revenue |
Website-sourced opportunities become customers |
Prove channel and content contribution |
|
New MRR |
New customers from website journeys create recurring revenue |
Measure acquisition revenue impact |
|
ARR |
Annualized recurring revenue from website-influenced customers |
Compare high-value channels and segments |
|
Expansion MRR |
Website-acquired accounts expand after adoption |
Judge cohort quality by source |
|
ARPU |
Average revenue per account by channel or segment |
Compare plan mix and account value |
How Do Retention And Churn Affect SaaS Website Metrics?
Retention and churn affect SaaS website metrics by showing whether converted users become durable customers or short-lived accounts. A channel with high trial volume and high churn has weaker acquisition quality than a smaller channel that produces retained revenue, expansion MRR and stronger NRR.
- Customer retention shows the percentage of accounts that keep paying after acquisition.
- Churn rate shows the account or revenue loss attached to a cohort.
- NRR shows whether retained accounts expand enough to offset contraction and churn.
- GRR shows retained recurring revenue before expansion.
- Cohort quality compares retention by source, campaign, landing page and persona.
Retention connects website performance to customer fit, not only signup volume.
How Do CAC And Payback Relate To SaaS Website Metrics?
CAC and payback relate to SaaS website metrics because traffic quality and conversion rate influence how much acquisition spend turns into customers and how fast revenue recovers that spend. Website measurement links marketing cost, lead quality, sales efficiency and recurring revenue.
|
Efficiency metric |
Formula idea |
Website lever |
|---|---|---|
|
CAC |
Sales and marketing cost divided by new customers |
Qualified traffic and conversion rate |
|
CAC payback |
CAC divided by gross margin adjusted recurring revenue |
Pricing-page clarity and demo quality |
|
LTV:CAC |
Customer lifetime value compared with acquisition cost |
Retention by source and customer segment |
|
Marketing efficiency |
Revenue or pipeline created per marketing dollar |
Channel mix and landing page performance |
|
Conversion efficiency |
Qualified conversions per visitor or campaign dollar |
Form friction, CTA relevance and ICP fit |
How Should SaaS Website Metrics Be Mapped Across The Funnel?
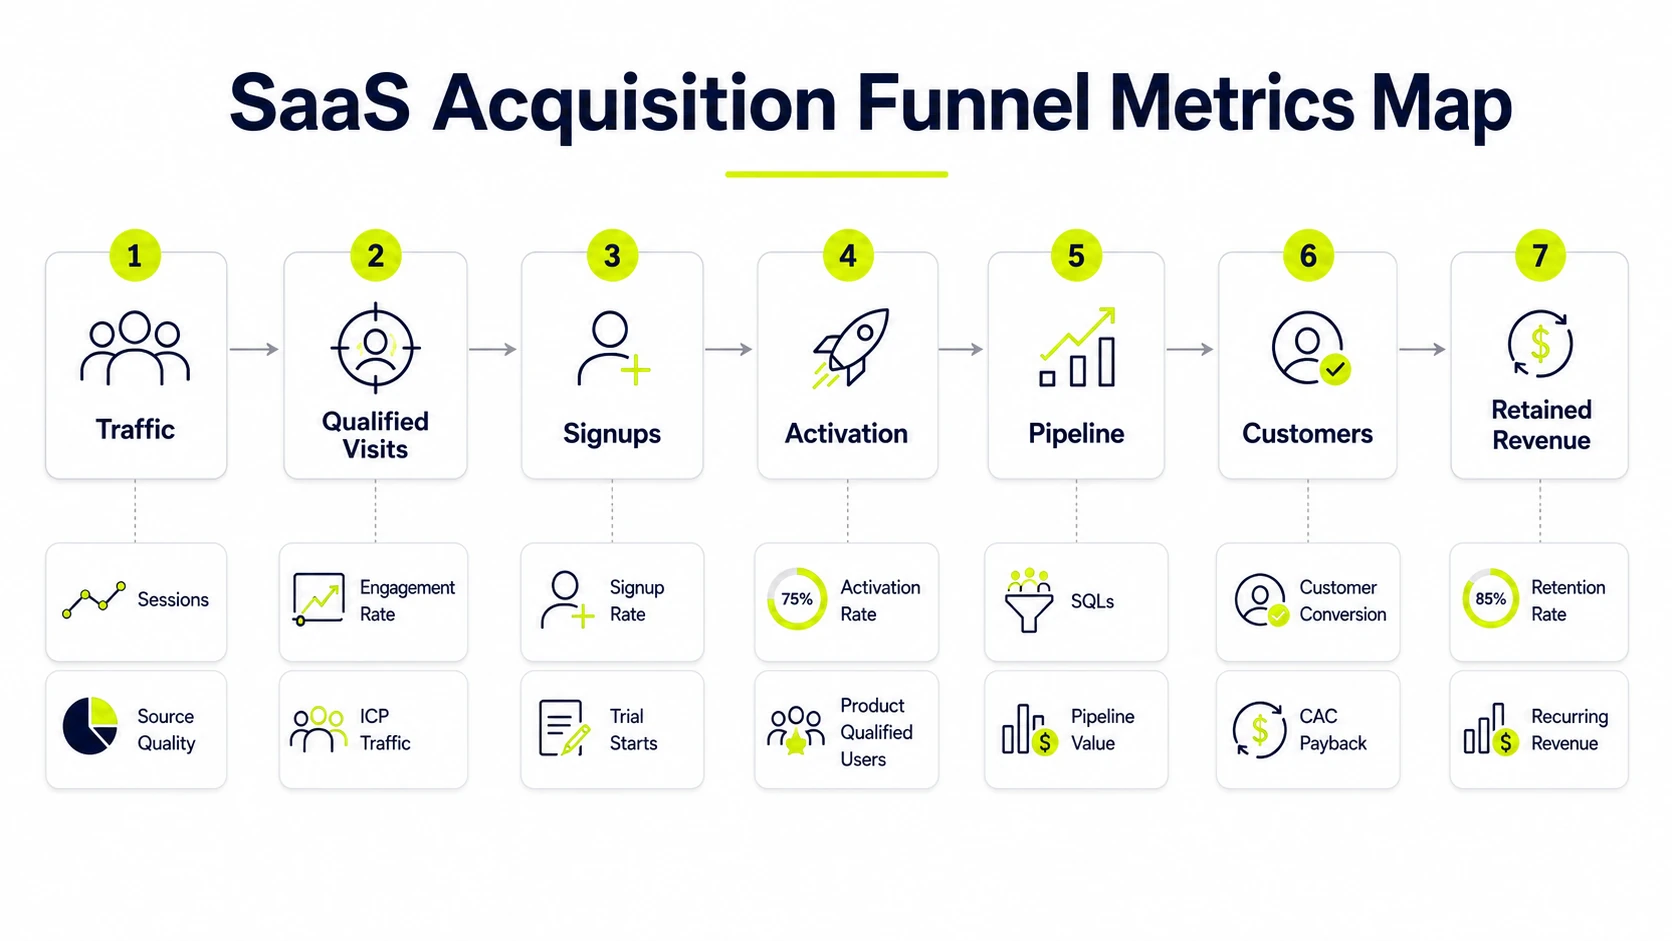
SaaS website metrics are mapped across the funnel by assigning each metric to acquisition, engagement, conversion, activation, revenue, retention or expansion. This map creates one context vector from traffic quality to retained revenue and shows which decision each metric supports.
SaaS website metrics must be mapped by funnel stage so each metric supports a specific decision.
|
Funnel stage |
Core metrics |
Main question answered |
Decision supported |
|---|---|---|---|
|
Acquisition |
Sessions, users, source / medium, campaign |
Which channels bring qualified visitors? |
Channel investment |
|
Engagement |
Engaged sessions, scroll depth, page path, pricing-page visits |
Which visitors inspect buying content? |
Content and landing page changes |
|
Conversion |
Demo requests, trial signups, form completions, visitor-to-lead rate |
Which visitors show demand? |
CTA and offer testing |
|
Activation |
Onboarding completion, first value, PQL rate, trial-to-paid rate |
Which signups become product users? |
Onboarding and product changes |
|
Revenue |
Pipeline, closed-won revenue, new MRR, ARR |
Which website journeys create revenue? |
Campaign and sales prioritization |
|
Retention |
Churn, NRR, GRR, renewal rate by source |
Which cohorts stay? |
ICP and channel quality decisions |
|
Expansion |
Expansion MRR, upsell rate, account growth |
Which cohorts expand? |
Lifecycle and account marketing |
How Should SaaS Websites Attribute Conversions And Revenue?
SaaS websites attribute conversions and revenue by keeping campaign, landing page, form, CRM, pipeline and billing records connected through shared identifiers. Attribution works best when the same source data follows the user from first visit to demo, opportunity, customer and MRR.
- Capture UTM parameters, landing page and referrer on the first visit.
- Store source data on demo forms, signup forms and CRM lead records.
- Connect CRM pipeline stages to opportunity and customer IDs.
- Match closed-won customers to new MRR, ARR and expansion MRR.
- Report revenue influence by source, campaign, landing page and segment.
What Should A SaaS Website Metrics Dashboard Include?
A SaaS website metrics dashboard includes the metrics each team uses to evaluate traffic quality, conversion, activation, revenue influence and retention. The dashboard format has more decision value when executive, marketing, sales, product and finance views share definitions but show different actions.
|
Dashboard section |
Core metrics |
Owner |
Action |
|---|---|---|---|
|
Executive view |
Website-sourced pipeline, new MRR, ARR, CAC payback, NRR |
Leadership |
Review growth quality and efficiency |
|
Marketing view |
Qualified sessions, source / medium, landing page conversion, pricing-page conversion |
Marketing |
Adjust channels, pages and campaigns |
|
Sales view |
Demo requests, qualified leads, opportunity rate, closed-won revenue |
Sales |
Prioritize follow-up and qualification |
|
Product view |
Trial signups, activation rate, first value, PQL rate |
Product and growth |
Improve onboarding and product adoption |
|
Finance view |
CAC, ARPU, payback, revenue by cohort |
Finance |
Compare spend, revenue and payback |
Which SaaS Website Metrics Should Be Reviewed Weekly Versus Monthly?
Weekly reviews focus on metrics that move fast enough for tactical changes, while monthly reviews focus on revenue, retention and efficiency trends. Cadence separates operating signals from outcome signals.
|
Review cadence |
Metrics |
Owner |
Decision |
|---|---|---|---|
|
Weekly |
Qualified sessions, demo requests, trial signups, landing page conversion, form errors |
Marketing and growth |
Fix campaigns, pages and conversion friction |
|
Monthly |
New MRR, CAC, CAC payback, churn, NRR, channel cohort quality |
Leadership, finance and revenue operations |
Reallocate budget, revise targets and inspect cohort quality |
What Are Good SaaS Website Metrics Benchmarks?
Good SaaS website metrics benchmarks are directional comparisons filtered by company stage, ACV, audience, sales motion, pricing model and channel mix. A benchmark has weak value when it ignores whether the SaaS product is sales-led, PLG, enterprise, self-serve, horizontal or vertical.
|
Benchmark area |
What to compare |
Caution |
|---|---|---|
|
Traffic quality |
Qualified sessions by source and landing page |
Raw traffic benchmarks hide intent quality |
|
Conversion rate |
Demo, trial and qualified conversion rates |
Sales-led and PLG motions behave differently |
|
Activation |
First value completion and trial-to-paid rate |
Product complexity changes activation timing |
|
Revenue |
New MRR, ARR, ARPU and pipeline by source |
ACV and pricing model change expected value |
|
Retention |
Churn, NRR and GRR by acquisition cohort |
Early-stage cohorts often swing sharply |
How Should SaaS Website Metrics Be Segmented For Better Decisions?
SaaS website metrics are segmented by source, campaign, landing page, persona, company size, plan, device, geography and lifecycle stage to show which audience and journey creates useful outcomes. Segmentation turns one blended average into decision-ready performance patterns.
Use these segments first:
- Traffic source and campaign for acquisition quality.
- Landing page and content type for intent quality.
- Persona, company size and industry for ICP fit.
- Plan, pricing tier and sales motion for revenue value.
- Device, geography and lifecycle stage for journey friction.
Segmented reporting reveals quality differences hidden inside sitewide averages.
Which Tools Are Used To Track SaaS Website Metrics?
SaaS website metrics use analytics, product, CRM, marketing automation, billing, warehouse and dashboard tools because no single platform records the full journey from visit to retained revenue. Each tool captures a different part of the measurement chain.
|
Tool category |
Examples |
Data captured |
|---|---|---|
|
Web analytics |
GA4, Adobe Analytics, Plausible |
Sessions, source, events, landing pages |
|
Product analytics |
Mixpanel, Amplitude, PostHog |
Activation, PQLs, feature usage, retention |
|
CRM |
HubSpot, Salesforce, Pipedrive |
Leads, opportunities, pipeline and closed-won revenue |
|
Marketing automation |
HubSpot, Marketo, Customer.io |
Campaigns, forms, lifecycle and nurture data |
|
Billing and subscription |
Stripe, Chargebee, Paddle |
MRR, ARR, churn, expansion and invoices |
|
Warehouse and BI |
BigQuery, Snowflake, Looker, Power BI |
Joined reporting and dashboard views |
What Mistakes Should Be Avoided When Tracking SaaS Website Metrics?
The main SaaS website metrics mistakes are vanity reporting, duplicate definitions, unsegmented traffic, attribution gaps, dashboard overload and metrics with no decision owner. These errors create reports that look complete but fail to explain acquisition quality, revenue influence or retention outcomes.
The most common SaaS website metrics mistakes are listed below with prevention notes.
- Tracking raw traffic as success. Prevent it by pairing sessions with source quality, ICP fit and conversion value.
- Using duplicate metric definitions. Prevent it by documenting one definition for leads, demos, trials, PQLs, MRR and churn.
- Reporting unsegmented traffic. Prevent it by separating channel, campaign, landing page, persona and lifecycle stage.
- Stopping attribution at form submission. Prevent it by connecting CRM opportunities, customers and recurring revenue.
- Overloading dashboards. Prevent it by assigning each metric to one owner and one decision.
- Ignoring retention by source. Prevent it by comparing churn, NRR and cohort quality against acquisition channels.
- Mixing sales-led and PLG conversions. Prevent it by tracking demo requests separately from trial signups.
A clean measurement system removes metrics that do not support action.
Which SaaS Website Metrics Are Often Missing From Generic SaaS KPI Lists?
Generic SaaS KPI lists often miss website-specific metrics that explain how demand becomes qualified pipeline and retained revenue. The missing metrics usually sit between marketing analytics, product activation and CRM reporting.
- Pricing-page conversion by source and segment.
- Demo quality by lead score, company size and sales acceptance.
- Trial activation by signup source and onboarding milestone.
- Content-assisted conversions by landing page and buyer stage.
- Channel-to-revenue attribution across pipeline, new MRR and retained cohorts.
- Qualified pipeline created from website journeys.
These metrics fill the gap between website activity and SaaS business outcomes.
Is Website Traffic A Useful SaaS Metric?
YES, website traffic is useful when it is segmented by source, intent and conversion quality. In digital analytics, raw traffic alone is a vanity metric because it does not show qualified visitors, demos, trials, pipeline, revenue or retention. Useful traffic reporting connects visits to business actions.
Should SaaS Websites Track Demo Requests Separately From Trial Signups?
YES, SaaS websites track demo requests separately from trial signups because they represent different buying motions and intent levels. Demo requests usually indicate sales-led qualification. Trial signups indicate product-led self-serve activation and require different onboarding, routing and revenue analysis.
Can Website Conversion Rate Predict SaaS Revenue Growth?
YES, website conversion rate can predict SaaS revenue growth when lead quality, activation, sales close rate and retention are measured with it. Conversion rate alone misleads when low-quality signups increase without stronger opportunity creation, trial activation or retained revenue.
Is MRR Enough To Measure SaaS Website Performance?
NO, MRR is not enough to measure SaaS website performance because it shows recurring revenue after many upstream events. Data tracking for acquisition source, conversion quality, activation, attribution and churn explains why MRR changes and which website actions influenced the revenue path.
Should SaaS Website Metrics Be Segmented By Traffic Source?
YES, web analytics metrics for SaaS are segmented by traffic source so teams compare channel quality, conversion rate, CAC impact and revenue attribution. Source segmentation shows whether organic, paid, partner, referral or direct traffic produces stronger demos, trials, pipeline and retained customers.
Are Generic SaaS Benchmarks Reliable?
NO, generic SaaS benchmarks are not fully reliable for website decisions. Use them as directional context, then compare performance by company stage, ACV, audience, sales motion, pricing model and historical trend. SaaS website metrics stay useful when traffic quality, conversion, revenue influence, retention and CAC payback remain connected.

Written by
Zunnun
Digital analytics consultant helping businesses make data-driven decisions. Specializing in GA4, GTM, conversion tracking, and marketing attribution to turn messy data into profitable growth strategies. Semantic SEO expert in the Koray Tuğberk Gübür methodology.