User Behavior Tracking: Definition, Methods, Metrics, Tools and Use Cases
Zunnun · · 12 min read
User behavior tracking gives analytics teams a structured record of clicks, sessions, events, journeys and conversion actions across websites, apps and digital products. The page explains the term, collected data, tracking methods, setup process, metrics, tools, use cases, privacy checks and common mistakes. The scope stays on product, UX and web analytics, not cybersecurity UEBA, broad marketing analytics, or vendor promotion.
What is user behavior tracking?
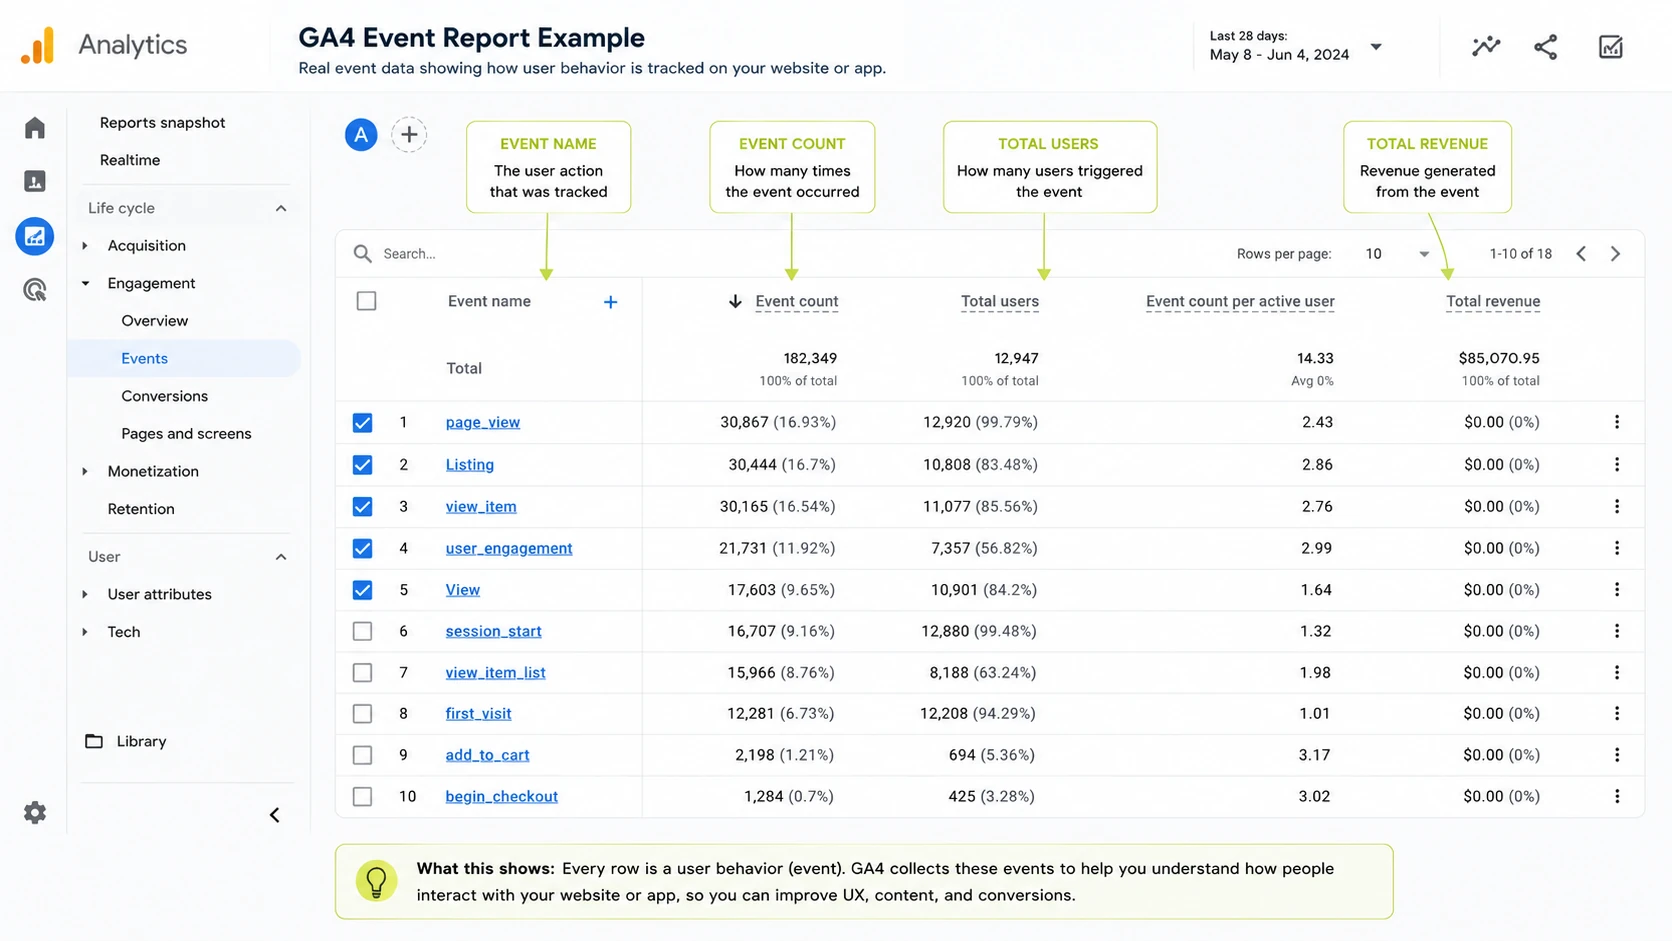
User behavior tracking is the collection and analysis of digital user actions, including clicks, scrolls, sessions, events, paths and conversions, so teams can measure how people use a website, app, or product. Behavior analytics connects user interactions to decisions about UX, content, product adoption and conversion paths.
- Click tracking records button taps, link clicks and dead clicks.
- Scroll tracking shows whether visitors reach content, forms and calls to action.
- Session and journey data shows page paths, repeated visits and exit points.
- Conversion data connects user actions to form submissions, purchases, signups and feature adoption.
What does user behavior tracking include?
User behavior tracking includes event data, session data, journey data, feedback signals and conversion outcomes that describe what users do and what those actions change in reporting.
|
Data category |
Examples |
Decision it supports |
Privacy sensitivity |
|---|---|---|---|
|
Event data |
button_click, form_submit, video_start, purchase |
Which actions matter in the funnel |
Medium |
|
Page and session metrics |
page views, session duration, bounce rate, exit rate |
Which pages hold attention or lose users |
Low to medium |
|
Journey data |
paths, funnel steps, drop-off points, repeat visits |
Where navigation breaks or succeeds |
Medium |
|
Qualitative evidence |
heatmaps, session recordings, surveys, feedback widgets |
Why a behavior pattern appears |
Medium to high |
|
Conversion outcomes |
leads, signups, purchases, activations, retained users |
Which behavior creates business results |
Medium |
What data is collected in user behavior tracking?
User behavior tracking collects interaction, journey, metric, feedback and outcome data, then connects each data type to a specific analytics decision rather than a flat KPI list.
|
Data group |
Typical fields |
What it reveals |
Decision it supports |
|---|---|---|---|
|
Interaction data |
clicks, taps, scrolls, form fields and downloads |
Which page elements receive attention |
Change layout, placement, copy, or form design |
|
Journey data |
entry page, path, funnel step, exit page and repeat visit |
How users move through the product or site |
Fix navigation, onboarding, or checkout flow |
|
Metric data |
bounce rate, drop-off rate, engagement and retention |
Where behavior changes across segments |
Prioritize tests and reporting views |
|
Feedback data |
survey answers, ratings, comments and support themes |
Why users act in a specific pattern |
Add content, fix friction, or revise messaging |
|
Outcome data |
lead, signup, trial, purchase, activation and renewal |
Which actions create measurable results |
Map behavior signals to conversion goals |
What are the main methods for tracking user behavior?
The main user behavior tracking methods combine quantitative measurement with qualitative evidence so analytics teams see both the action pattern and the reason behind it.
- Event tracking records specific user actions such as button_click, form_submit, video_start and purchase.
- Heatmaps visualize click, move and scroll patterns on a page or screen.
- Session recordings show individual visits and reveal hesitation, rage clicks, dead clicks and repeated navigation.
- Funnel analysis measures completion and abandonment across checkout, signup, onboarding, or activation steps.
- Journey analytics maps path analysis across landing pages, product screens and repeated sessions.
- Surveys and feedback widgets add stated user intent, objections and satisfaction signals.
- Cohort analysis compares behavior across acquisition date, plan type, source, device, or lifecycle stage.
- A/B testing connects observed friction to controlled design, copy, or flow changes.
How do qualitative and quantitative tracking data differ?
Quantitative tracking data shows what happened at scale, while qualitative evidence explains why users acted that way through recordings, heatmaps, surveys and visible friction patterns.
|
Data type |
Examples |
Best use |
Limit |
|---|---|---|---|
|
Quantitative |
conversion rate, drop-off rate, sessions, retention and feature adoption |
Measure frequency, scale and trend direction |
Explains less about user motivation |
|
Qualitative |
session replay, heatmaps, surveys, interviews and feedback comments |
Explain friction, confusion and intent |
Uses smaller samples and requires review |
How does tracking reveal journeys and funnel drop-offs?
User behavior tracking reveals journeys and funnel drop-offs by mapping the intended path, measuring actual event completion and comparing abandonment points with qualitative friction evidence.
- Map the intended journey, such as landing page to signup, checkout, onboarding, or activation.
- Track each required event with consistent names, parameters and timestamps.
- Visualize actual paths to find loops, backtracking, skipped steps and exits.
- Measure drop-off by step, segment, device and traffic source.
- Review session recordings, heatmaps and error logs for the pages with the largest loss.
A checkout funnel, for example, connects cart_view, shipping_submit, payment_start and purchase events to form errors, coupon-field clicks and mobile layout issues.
How do teams set up user behavior tracking?
Teams set up user behavior tracking by defining goals, mapping events, selecting tools, installing tags or SDKs, validating data, segmenting reports and scheduling review cycles.
- Define the business goal, such as lead quality, checkout completion, onboarding activation, retention, or content engagement.
- Create an event taxonomy with event names, parameters, user properties and conversion outcomes.
- Choose the tracking stack by channel and product type: GA4 for web analytics, product analytics for feature adoption, heatmaps for visual behavior and surveys for stated feedback.
- Install tags, SDKs, data layer pushes, or server-side events according to the tool requirements.
- Configure consent notices, privacy policy disclosures, masking rules and data-retention settings before data collection starts.
- Validate events in DebugView, tag preview tools, realtime reports and sample sessions.
- Segment dashboards by source, device, lifecycle stage, cohort and conversion status.
- Schedule weekly funnel checks and monthly trend reviews so the data creates decisions rather than unused reports.
How do teams segment user behavior tracking?
Teams segment user behavior tracking by separating users into groups that explain different journey patterns, friction points and conversion outcomes.
- Traffic source shows how paid, organic, email and referral visitors behave.
- Device type separates mobile layout friction from desktop behavior.
- Lifecycle stage compares new visitors, trial users, active users and retained customers.
- Cohorts group users by signup date, campaign, release version, or first purchase month.
- Geography and plan type reveal market or account differences.
- New versus returning status separates discovery behavior from repeat engagement.
Which metrics matter for user behavior tracking?
The metrics that matter for user behavior tracking depend on the decision under review: engagement, navigation friction, conversion, retention, adoption and satisfaction require different measurement groups.
|
Metric group |
Example metrics |
What it reveals |
Decision it supports |
|---|---|---|---|
|
Engagement |
engaged sessions, scroll depth, time on page and repeat visits |
Whether users consume or ignore content |
Revise content depth, layout, or calls to action |
|
Navigation and friction |
rage clicks, dead clicks, error rate and exit rate |
Where users struggle |
Fix forms, menus, buttons, or page speed issues |
|
Conversion |
conversion rate, funnel completion and drop-off rate |
Which step loses users |
Prioritize checkout, lead form, or signup tests |
|
Retention |
returning users, cohort retention and churn signals |
Whether behavior continues after the first visit |
Improve onboarding, messaging, or lifecycle campaigns |
|
Product adoption |
feature use, activation rate and path to first value |
Which product actions create engagement |
Adjust roadmap, onboarding, or in-app education |
|
Satisfaction |
survey score, feedback topic and support contact rate |
How users describe the experience |
Fix confusion and update help content |
Which tools are used for user behavior tracking?
User behavior tracking tools fall into categories based on the evidence they collect: traffic events, visual behavior, product actions, user feedback, experiments and digital experience monitoring.
|
Tool category |
Representative tools |
Best use |
Common limit |
|---|---|---|---|
|
Web analytics |
Google Analytics 4, Adobe Analytics and Matomo |
Traffic, events, attribution and high-level conversion reports |
Limited visual context |
|
Heatmap and replay |
Hotjar, Microsoft Clarity, FullStory and UXCam |
Clicks, scrolls, recordings and visible friction |
Sampling and privacy masking required |
|
Product analytics |
Amplitude, Mixpanel, Heap and Pendo |
Feature adoption, cohorts, funnels and retention |
Requires event taxonomy discipline |
|
Feedback and survey |
Sprig, Qualtrics and Typeform |
User motivation, objections and satisfaction |
Smaller response sample |
|
Experimentation |
Optimizely, VWO and AB Tasty |
Test design, page changes and outcome measurement |
Requires enough traffic |
|
Digital experience analytics |
Contentsquare and Dynatrace |
Journey analytics, technical issues and experience diagnostics |
Higher setup and governance effort |
How to choose a user behavior tracking tool?
Teams choose a user behavior tracking tool by matching the tool category to the platform, analysis depth, privacy requirements, integrations, budget and team skill level.
- Use web analytics for traffic, channels, events and conversion reporting.
- Use heatmaps and replay when visual friction explains drop-offs.
- Use product analytics when feature adoption, cohorts and retention matter.
- Use survey tools when user motivation or objection data is missing.
- Check privacy controls, masking, consent settings, sampling, integrations and export options before purchase.
What are common user behavior tracking use cases?
Common user behavior tracking use cases connect a user action pattern to a product, UX, marketing, support, or revenue decision.
- UX improvement: heatmaps and replay identify confusing buttons, dead clicks and missed content.
- Onboarding analysis: activation events show which setup steps new users complete or skip.
- Checkout recovery: funnel tracking finds the payment, shipping, coupon, or account step with the largest abandonment.
- Feature adoption: event data shows which product features users try, repeat and ignore.
- Content engagement: scroll depth and click tracking show which sections attract attention.
- Retention analysis: cohort behavior shows whether users return after signup, purchase, or activation.
- Marketing analysis: source-level behavior shows which campaigns create engaged sessions and conversion actions.
- Support diagnostics: recordings, errors and feedback show where help content or product copy fails.
What are examples of user behavior tracking?
User behavior tracking examples include specific event and journey records that show how users act before friction, conversion, abandonment, or repeat engagement.
- Abandoned checkout steps: cart_view, shipping_submit, payment_start and purchase events reveal the loss point.
- Repeated form errors: form_error and field_blur events show confusing fields.
- Skipped onboarding screens: step_view and step_complete events reveal setup gaps.
- Dead clicks: replay and click maps show taps on non-clickable elements.
- Low feature adoption: feature_open, feature_use and repeat_use events show weak product uptake.
- Content scroll depth: scroll_25, scroll_50, scroll_75 and scroll_90 events show section engagement.
How is first-party analytics different from third-party behavior estimates?
First-party analytics records behavior on properties a team owns, while third-party estimates model external behavior from panels, crawlers, clickstream data, or other sampled sources.
|
Comparison point |
First-party analytics |
Third-party estimates |
|---|---|---|
|
Data source |
Owned website, app, product, or server events |
External panels, clickstream data and modeled datasets |
|
Best use |
Owned UX, funnel, product and conversion decisions |
Competitor research and market direction |
|
Accuracy |
Higher when tags, consent and events are validated |
Directional and dependent on model coverage |
|
Examples |
GA4, server logs, product analytics and replay tools |
SEO suites, traffic estimators and market intelligence tools |
What mistakes do teams avoid with user behavior tracking?
Teams avoid user behavior tracking mistakes by connecting every event, report, segment and tool setting to a specific analytics decision.
- Tracking without goals creates reports that do not answer a business question.
- Collecting every event creates data noise, privacy risk and maintenance work.
- Ignoring consent creates legal, ethical and reporting-quality risk.
- Skipping validation leaves duplicate events, broken tags and missing parameters unnoticed.
- Failing to filter bots and internal users distorts sessions, clicks and conversions.
- Relying on averages hides device, source, cohort and lifecycle differences.
- Using disconnected tools creates conflicting numbers across teams.
- Reading reports without action turns behavior analytics into unused storage.
The closing loop is practical: user behavior tracking, behavior analytics, event tracking, user journeys and privacy compliance produce better decisions only when the team validates data and acts on the finding.
Is user behavior tracking legal?
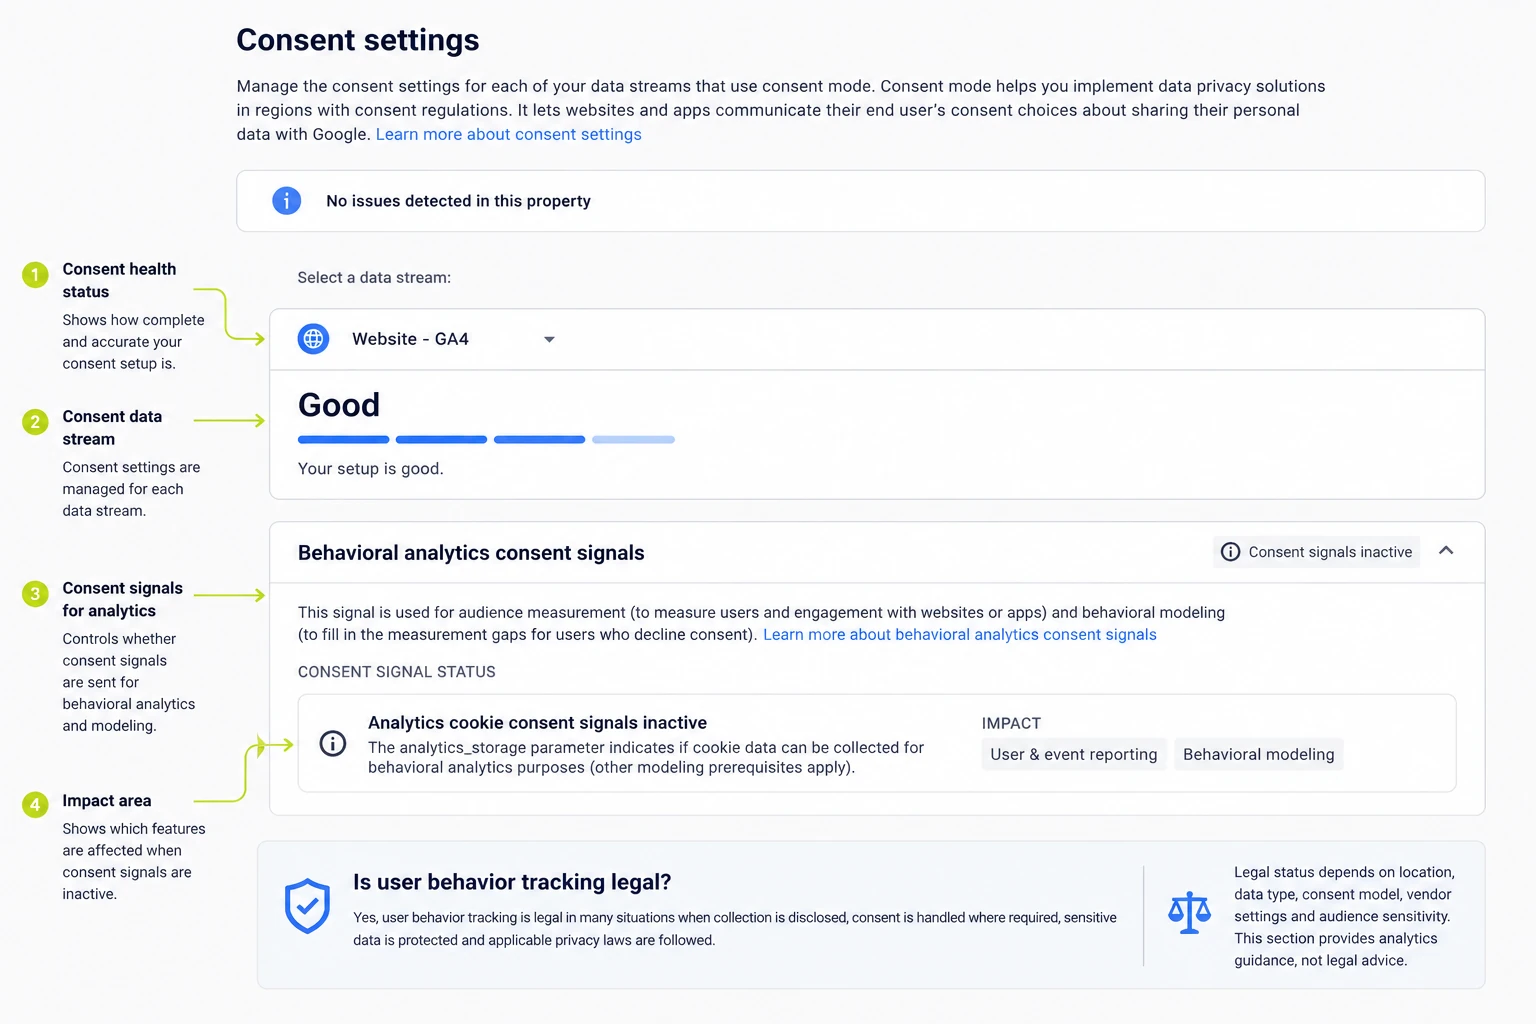
Yes, user behavior tracking is legal in many situations when collection is disclosed, consent is handled where required, sensitive data is protected and applicable privacy laws are followed.
Legal status depends on location, data type, consent model, vendor settings and audience sensitivity. This section provides analytics guidance, not legal advice.
Can user behavior tracking identify why users leave?
Yes, user behavior tracking identifies likely reasons users leave when funnel drop-off data is paired with replay, heatmap, survey, error log, or support-ticket evidence.
A checkout exit shows the abandonment point. A recording, error event, or survey answer explains whether price, form friction, load speed, payment failure, or missing information caused the exit.
Do teams track every possible user event?
No, teams track selected user events that connect to goals, funnels, adoption, errors and conversion decisions.
Excessive event collection creates noisy reports, privacy exposure, higher maintenance and unclear dashboards. A smaller event taxonomy with clear names, parameters and ownership produces cleaner analysis.
Can user behavior tracking work without cookies?
Yes, user behavior tracking works without cookies when tools use consented session data, server-side events, authenticated-user identifiers, aggregate reporting, or privacy-friendly analytics methods.
Cookieless tracking often reduces persistent user recognition across visits and devices. The reporting value shifts toward session-level behavior, first-party events and aggregate funnel patterns.
Does user behavior tracking slow down a website?
Yes, user behavior tracking slows down a website when too many scripts load, tags run synchronously, recordings capture excessive data, or vendors add heavy browser work.
Tag governance reduces the risk through asynchronous loading, sampling, script audits, container cleanup and performance checks after each tool deployment.
Is Google Analytics enough for user behavior tracking?
No, Google Analytics is not always enough for user behavior tracking because traffic and event reports lack visual evidence from heatmaps, session recordings, surveys and replay-based friction diagnosis.
GA4 records channels, events, pages and conversions well. Heatmap, replay, product analytics and feedback tools add the context required for UX, product and qualitative analysis.
Can user behavior tracking improve conversion rates?
Yes, user behavior tracking improves conversion rates when teams use the data to diagnose friction, form a test hypothesis, change the experience and measure the result.
Tracking alone does not improve a funnel. The improvement comes from validated behavior data, prioritized fixes, A/B tests and measurement after the change.

Written by
Zunnun
Digital analytics consultant helping businesses make data-driven decisions. Specializing in GA4, GTM, conversion tracking, and marketing attribution to turn messy data into profitable growth strategies. Semantic SEO expert in the Koray Tuğberk Gübür methodology.